A common requirement is to track changing trends: are visitors signing up? Has there been a sudden spike in forum posts? After spending some time rolling out my own solutions, I suddenly woke up and realised that I could use Munin to produce graphs like this:
Munin
From their website:
Munin is a networked resource monitoring tool that can help analyze resource trends and "what just happened to kill our performance?" problems. It is designed to be very plug and play. A default installation provides a lot of graphs with almost no work.
Munin comes with a large number of built-in plugins, and the Munin Exchange lists many more third-party plugins. Furthermore, writing our own plugins is straightforward.
I wlll assume that you have already setup Munin before starting this tutorial.
Integrating Munin and Django
The Munin site has a good primer on writing our own plugins. Basically, a plugin just needs to print to stdout a data value - the server will deal requesting this data on a regular basis, storing it, and displaying it on a nice graph.
I will run through 2 plugins that I have written for a Django site: a cache monitor, and a user search query counter.
Cache monitor
I'd written a site WorldPostcodes.info that used Django's built-in filecache[1] and I wanted to monitor how the cache filled up over time.
Writing our plugin as a Django management command seemed sensible, as it would allow us to easily access the contents of our Django project without any complicated path hacking. Here's the entire script:
from django.core.management.base import BaseCommand
from django.core.cache import cache

# Define the graph title, labels, etc...
# graph_title - appears at the top of the graph.
# graph_vlabel - label on y axis.
# graph_category - Munin organises graphs by category, here we have defined
# a new category for our site.
# graph_info - on the graph detail page, this is the title.
CONFIG = """graph_title WorldPostcodes filecache
graph_vlabel objects count
graph_category WorldPostcodes
graph_info Filesystem cache used by WorldPostcodes.
"""

# Add the fields that will be monitored.
# Here we have just one field "objects".
# The 2 attributes are used on the field description section of the
# graph detail page.
CONFIG += """objects.label Objects in cache
objects.info Number of objects in Django filecache.
"""

def run():
    print "objects.value %s" % cache._num_entries

class Command(BaseCommand):
    help = 'Cache usage stats.'

    requires_model_validation = True
    can_import_settings = True

    def handle(self, *args, **options):
        if 'config' in args:
            print CONFIG
        else:
            run()
Munin can call the plugin with a "config" argument, in which case the plugin has to print out its configuration details - see here for a full list.
Otherwise, we get the number of files (the Django cache class provides a convenient _num_entries property for this purpose) and print the result to stdout.
We now need to run this script, and here we are forced to jump through a clumsy extra hoop: because a management command is invoked through manage.py, we need to set up an intermediate script to run it. On my system it looks like this:
#!/bin/sh
/home/richard/DjangoSites/WorldPostcodes/manage.py munin_cache_usage $1
This script - which I decided to call wpc_cache_usage - needs to either go in the Munin Plugins folder (/etc/munin/plugins on my Ubuntu server), or be linked from it. Note how we pass to the management command the first argument received (Munin server can send one arg: "config"). The script is trivial, but we need to pay attention to permissions:
- We need to set the "execute" flag on the above plugin script.
- Munin needs to switch to the user under which your site is running before running our cache monitor.
This is easily set in file /etc/munin/plugin-conf.d/munin-node, where we can add new directives for our plugin:
[wpc_*]
user richard
group richard
Any plugin script that starts with wpc_ will now run as user 'richard' (which is useful as I have several Munin plugins running for this site and followed the same naming convention for all of them).
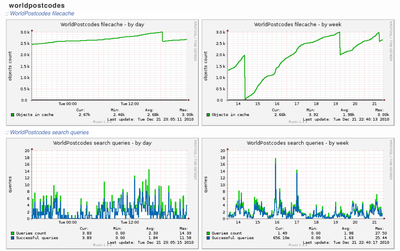
Now if we restart the Munin client we should start picking up stats, and after a while get something like this:
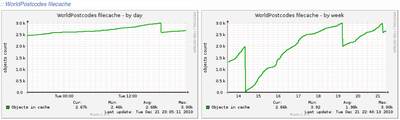
From the graph above we can see two things happening:
- The cache sometimes gets completely emptied - every time a new version of the website is deployed.
- The cache is undersized, frequently hitting the 3000 objects limit at which point it gets culled[2]. This is not optimal, and I need to look further into it.
Notes:
[1] yes I know that Memcached is the officially-recommended solution, but in this case a filecache was easy to implement and gave a more-than-sufficient performance boost.
[2] Further investigation quickly showed that the figures in fact need some fine-tuning as _num_entries only does a simple count of objects in the cache without checking if they were stale. Something else to look into… sometime!
Monitoring user searches
For our second example, we'll try something (a little) more complicated. Let's look at the source code:
from django.core.management.base import BaseCommand

from shared.models import SearchQuery

# Define the graph title, labels, etc...
# graph_title - appears at the top of the graph.
# graph_vlabel - label on y axis.
# graph_category - Munin organises graphs by category, here we have defined
# a new category for our site.
# graph_info - on the graph detail page, this is the title.
CONFIG = """graph_title WorldPostcodes search queries
graph_vlabel queries
graph_category WorldPostcodes
graph_info Search queries run on site.
"""

# Add the fields that will be monitored.
# The 2 attributes are used on the field description section of the
# graph detail page.
CONFIG += """queries.label Queries count
queries.info The number of queries carried out on the site.
success.label Successful queries
success.info Successful queries count.
"""


def run():
    new_queries = SearchQuery.objects.filter(munin_processed=False)
    successful = 0
    for q in new_queries:
        if q.got_answer:
            successful += 1
    print "queries.value %s" % new_queries.count()
    print "success.value %s" % successful
    new_queries.update(munin_processed=True)


class Command(BaseCommand):
    help = 'Cache usage stats.'

    requires_model_validation = True
    can_import_settings = True

    def handle(self, *args, **options):
        if 'config' in args:
            print CONFIG
        else:
            run()
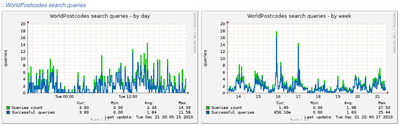
The website keeps a log of user queries in table SearchQuery. Our plugin filters & counts new queries, outputs the result, and marks them as processed in SearchQuery - dead easy.
The main point of this example is to show how a Munin plugin can monitor multiple fields. Here, I have defined "queries" and "success" (Success - a measure of the number of queries that we answered - is decided by a property "got_answer" on the SearchQuery instance).
Note: I am counting the number of queries that were successful - it would be nice to measure this figure as a percentage of the total number of queries, but Munin only allows one Y axis per graph...
And here's the output in Munin:
Conclusion
The above examples are pretty trivial, but hopefully will have shown that you don't necessarily have to roll your own performance monitoring application… the work has already been done by the Munin developers.